B2 Techniques to Analyse Data
Representative Values
When making decisions, managers may collect data sets of quantitative information to analyse. This may include sales data and costings. Market research data may include ages of customers, time spent on activities and clothing sizes. Large data sets can be hard to analyse so a range of techniques can be used to support this process.
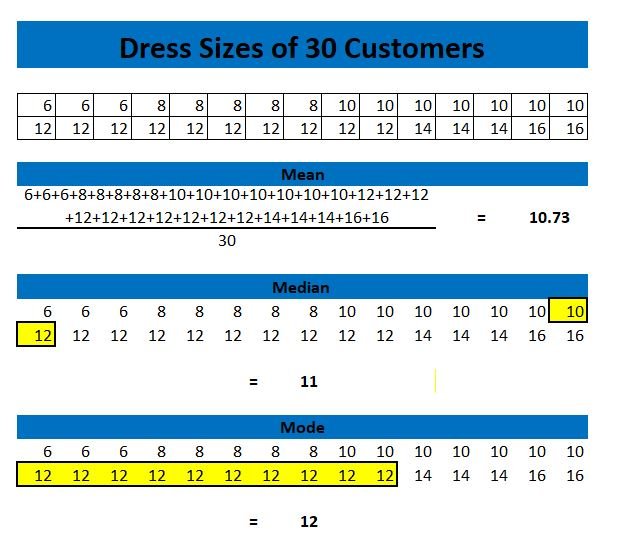
The mean, median and mode of a data set are average values. This means that they represent the most common numbers in a set.
The mean is calculated by adding up all the numbers in a set and dividing by the amount of numbers in that set.
The median is the middle number in a data set.
The mode is the most common number in a data set.
Software
A range of software products can support calculations that support the analysis of raw data include frequency distributions. Frequency distributions illustrate the number of times an entry occurs in a set of data.
This video talks through an example of how to create a frequency distribution using Excel