F3 Break-Even Charts
The break Even point is the level of output where costs equal revenue. No profit or loss is being made at this point. If one more unit is produced and sold, profit will be made. If one less unit is made and sold, a loss will be made. It is calculated using the following formula;
BEP = fixed costs / contribution
Or
BEP = fixed costs / (price - variable cost)
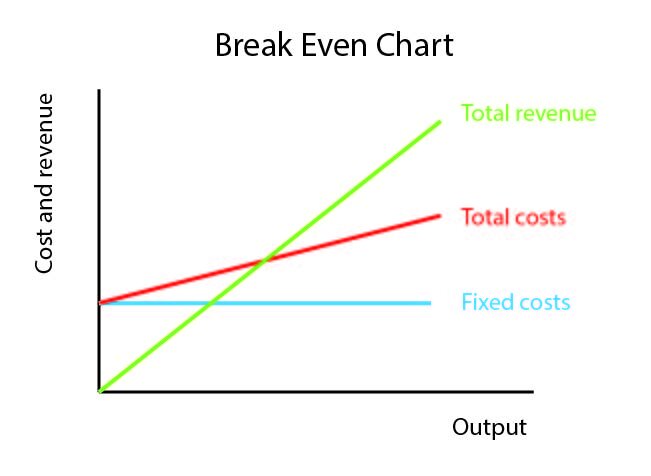
Costs and Revenues

Fixed costs are the costs that do not change with output such as rent and other premises costs, salaries and rental of machinery and equipment.
Variable costs are those that do change with output for example raw materials and packaging costs. If a business produced more of a product, they would have to purchase more raw materials and vice versa.
Total variable costs = variable costs x output
Total costs are the sum of the fixed costs and variable costs at each level of output.
Total costs = fixed costs + total variable costs
Semi-variable costs contain elements of both fixed and variable costs. They will usually be fixed up to a point and then become variable. An example of semi-variable costs is a phone bill where there is a set monthly bill up to a point but if the data package is exceeded, it is paid for per unit of data used.


Sales revenue is the money received from selling the products. It is calculated by multiplying the price by output.
Total revenue = price x output
Contribution is the amount of money per unit left after paying variable costs. This can be used to contribute towards fixed costs and profits.
Contribution = price - variable cost
Margin of Safety
The margin of safety (M.O.S.) is the amount of units sales can drop by before a loss is made. It is the difference between the estimated sales and break even point.
M.O.S. = estimated sales - BEP

Break Even Example
Beets Me Burgers have released the following financial data;
Fixed costs of $70,000 per month.
Variable costs of $30.
Selling price of $70.
Calculate the break even point and construct a break even chart for beats me burgers.
Calculate the margin of safety if output was 1300.
Benefits and Limitations of Break Even Analysis
Benefits
Quick and easy calculations
Charts are easy to interpret
Gives a production target
Can be used to estimate resource requirements
Can easily assess whether the production of a product is viable
Limitations
Assumes all products are sold
Assumes all lines are linear
Does not account for multiple products
Static model in a dynamic environment
Ignores factors other than cost and revenue
GIGO