B2 Quartiles, Percentiles and Correlation Coefficient
When dealing with large data sets, decision makers may group data to make it easier to analyse, perform calculations and interpret results.
Quartiles are groups of data that are split into four sets. The data set is put in order of ascending or descending results and split more or less equally.
Percentiles are are the values that fall below a specified percentage. For example, if you score in the 90% percentile on the test, that means 90% of the other people scored below you.

A correlation coefficient measures the relationship between two variables. A coefficient of +1 means there is a perfectly positive correlation between the two variables, a coefficient of -1 means there is a perfectly negative correlation between the two variables and a coefficient of 0 means there is no relationship between the two variables.
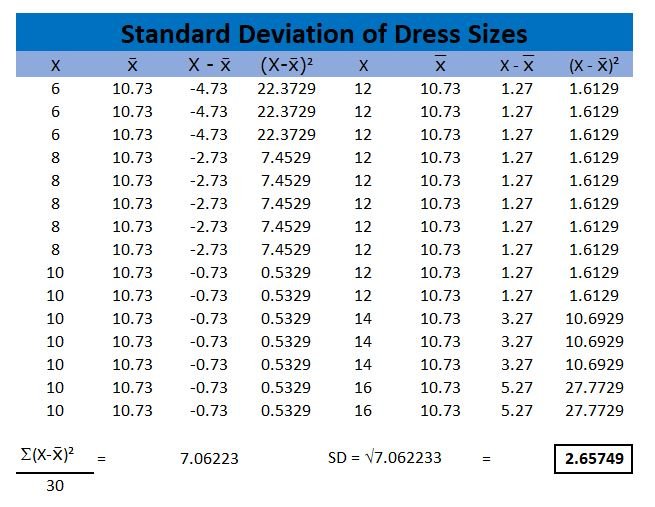
Standard deviation is a measure of the dispersion of the values are in a data set. A low standard deviation indicates that the values are generally closer to the mean and a high standard deviation indicates that the values are spread further from the mean.